Relative Strength Index
Oscillators, RSI
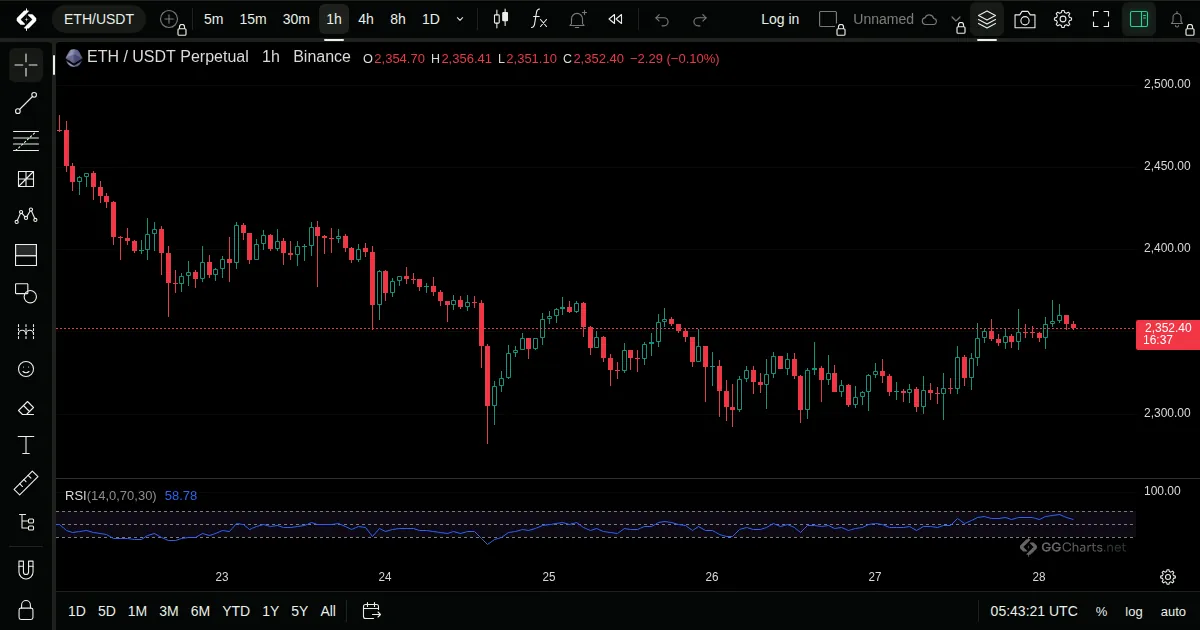
- What it shows
RSI compares recent upward and downward price changes on a scale from 0 to 100. A high or low reading is not a prediction of the next price move.
- How it is built
It divides the average gain by the average loss over the period and scales the result to 0 to 100.
- How to use it
- Above 70 is read as overbought, below 30 as oversold.
- In a strong trend it can stay at an extreme for a long time.
- A divergence between price and RSI is read as a weakening move.
- History
Introduced in his book New Concepts in Technical Trading Systems (1978).
J. Welles Wilder Jr., 1978
Related indicators
Moving Average Convergence DivergenceStochasticStochastic RSICommodity Channel Index