Stochastic RSI
Oscillators, Stoch RSI
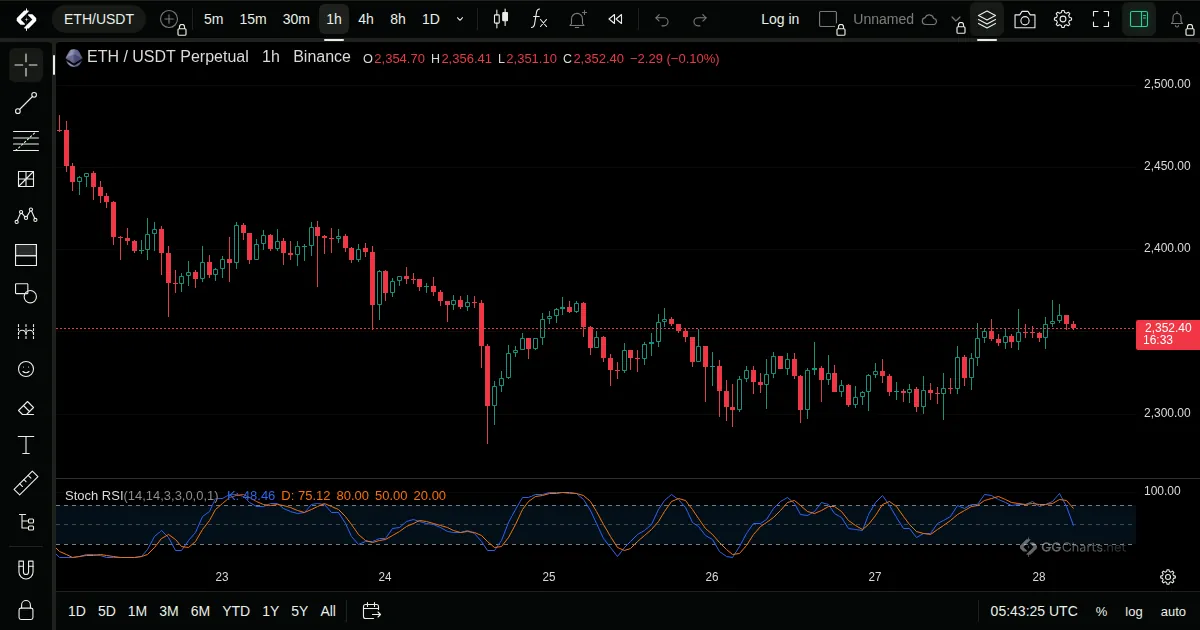
- What it shows
The stochastic formula applied to RSI instead of price, so it moves faster and swings more between its extremes.
- How it is built
It takes where RSI sits within its own recent range and smooths the result into K and D lines.
- How to use it
- Reaches the extremes more often than RSI.
- K crossing D is used as a timing signal.
- It is sensitive, so confirmation with price is useful.
- History
Presented in the book The New Technical Trader (1994).
Tushar Chande and Stanley Kroll, 1994
Related indicators
Commodity Channel IndexWilliams %RAwesome OscillatorMomentum