Stochastic
Oscillators
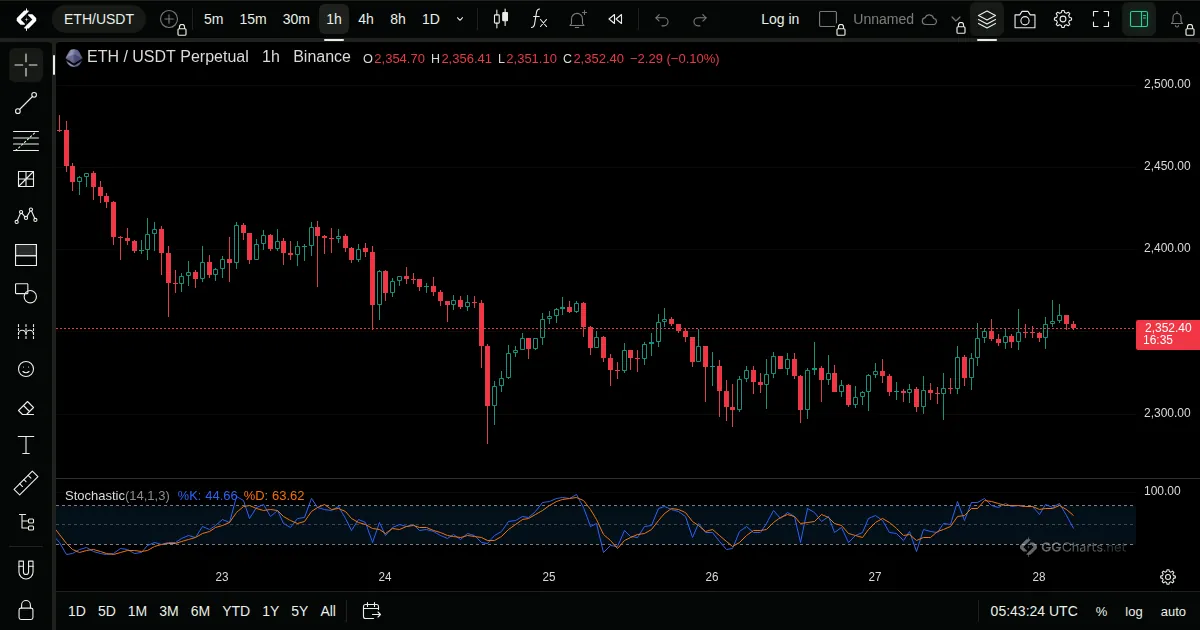
- What it shows
Stochastic compares the close with the high-low range over the selected period. Its lines describe where price sits within that range.
- How it is built
%K is the close's position within the range of the last N bars. %D is a moving average of %K.
- How to use it
- Above 80 is read as overbought, below 20 as oversold.
- %K crossing %D is the usual signal.
- In trends it can stay at the extremes.
- History
Developed by George Lane in the late 1950s.
George Lane, late 1950s
Related indicators
Stochastic RSICommodity Channel IndexWilliams %RAwesome Oscillator
Moving Average Convergence Divergence← All indicatorsStochastic RSI