Moving Average Convergence Divergence
Oscillators, MACD
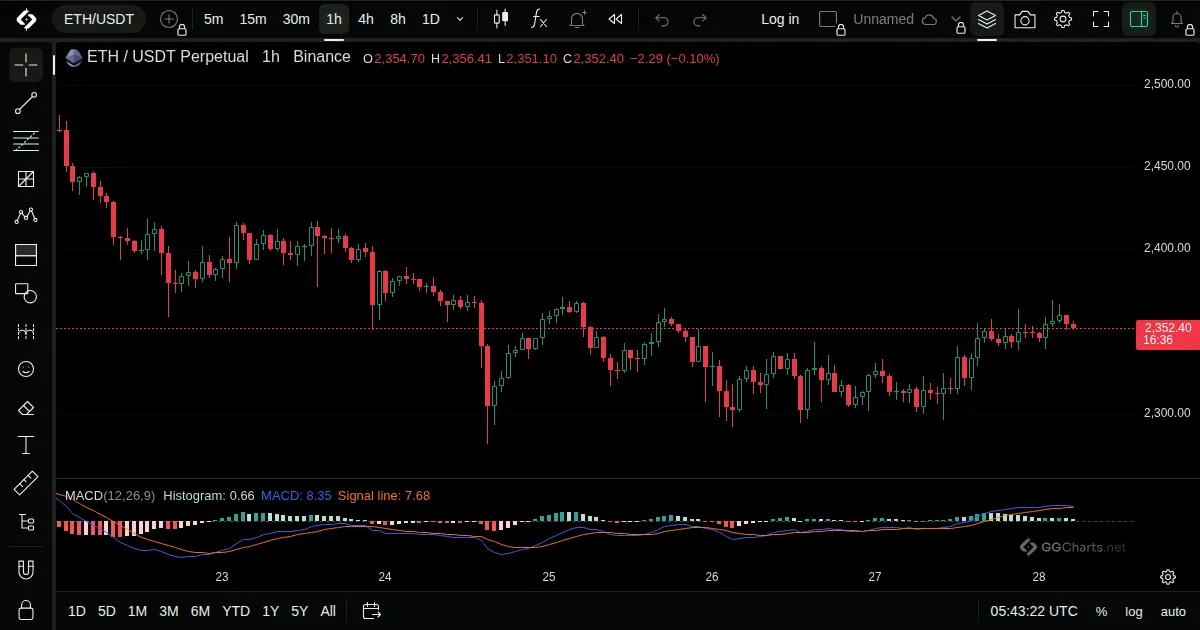
- What it shows
MACD shows the difference between a fast and a slow moving average, together with a signal line and histogram.
- How it is built
The MACD line is the fast EMA minus the slow EMA. The signal line is an EMA of the MACD line, and the histogram is the gap between them.
- How to use it
- MACD above its signal line favours buyers, below it sellers.
- A cross of the zero line shows the two averages swapping places.
- A shrinking histogram shows momentum fading.
- History
Developed by Gerald Appel in the late 1970s. The histogram was added later by Thomas Aspray in 1986.
Gerald Appel, late 1970s