Pring's Special K
Oscillators
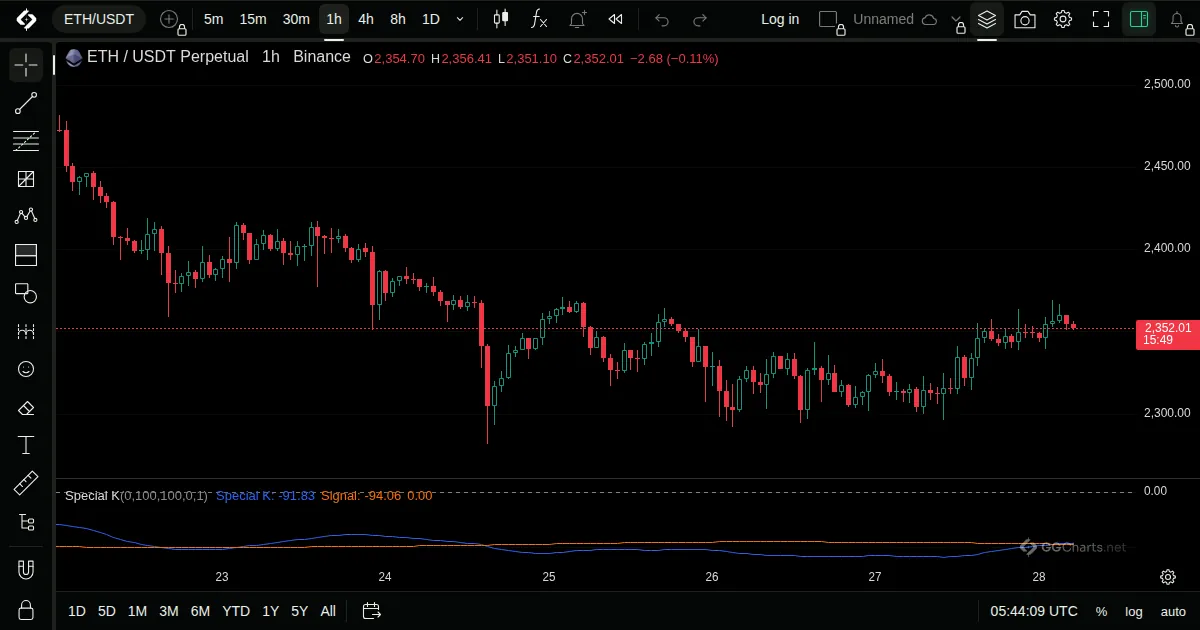
- What it shows
A long-term momentum line that sums rates of change over many spans to find the main cycles of the market.
- How it is built
Several smoothed rates of change are weighted and added together.
- How to use it
- Meant for long-term charts.
- Turns up and down with major cycles.
- Needs plenty of history to work.
Related indicators
Advance-Decline Ratio (Bars)RSI Divergence IndicatorGG-OscRelative Strength Index
Trend Strength Index← All indicatorsAdvance-Decline Ratio (Bars)