BBTrend
Volatility
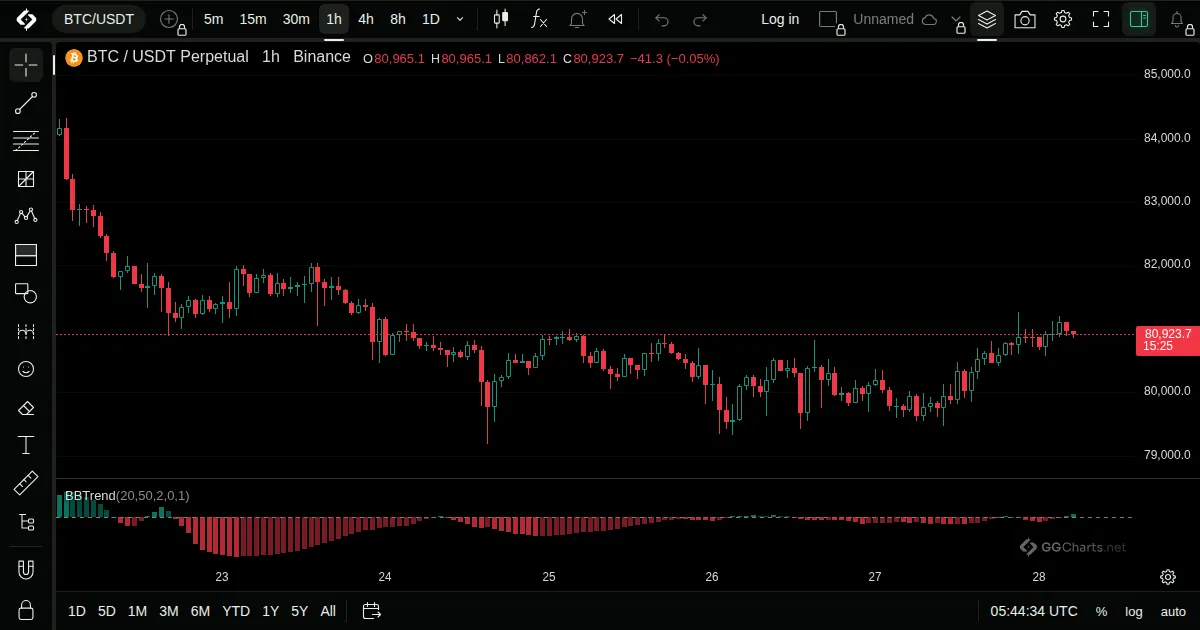
- What it shows
A histogram that compares a short and a long Bollinger Band to show the trend and its strength.
- How it is built
It measures how far the short band's edges are from the long band's edges, relative to the middle line.
- How to use it
- Above zero: uptrend, below zero: downtrend.
- Taller bars show a stronger trend.
- Shrinking bars show the trend fading.