Average Daily Range
Volatility, ADR
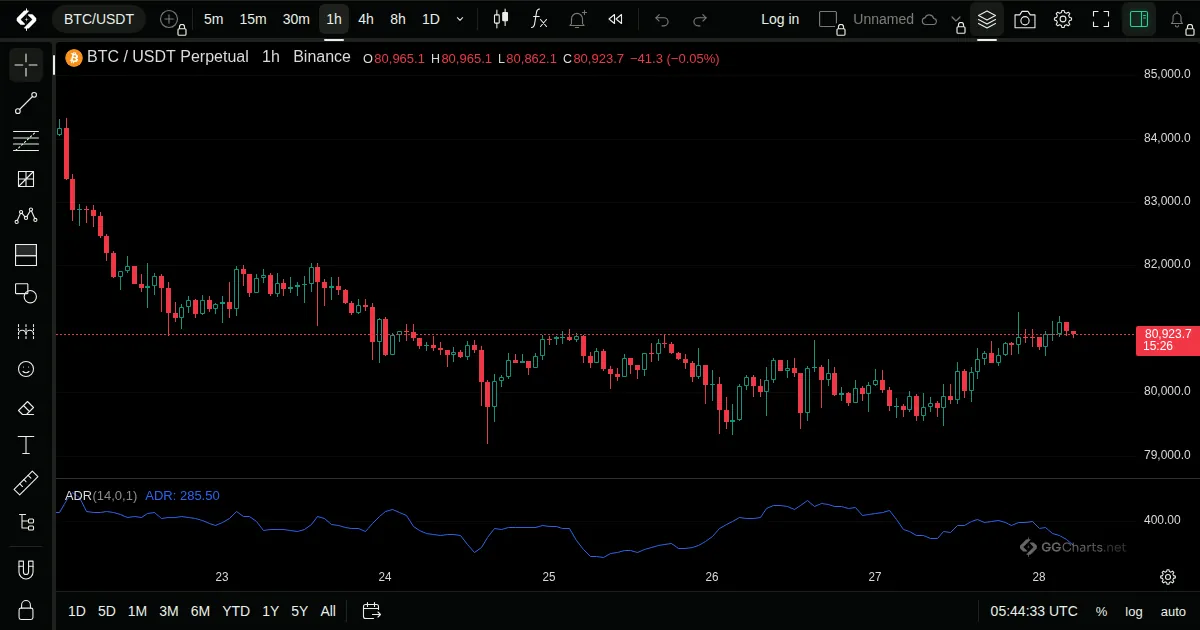
- What it shows
The average of the daily high to low range over the last N days.
- How it is built
For each day the high minus the low is taken, and the average of the last days is plotted.
- How to use it
- Shows how far a market usually moves in a day.
- Useful to judge whether a move is large or small.
- It is a range, not a direction.