Average Directional Index
Trend, ADX
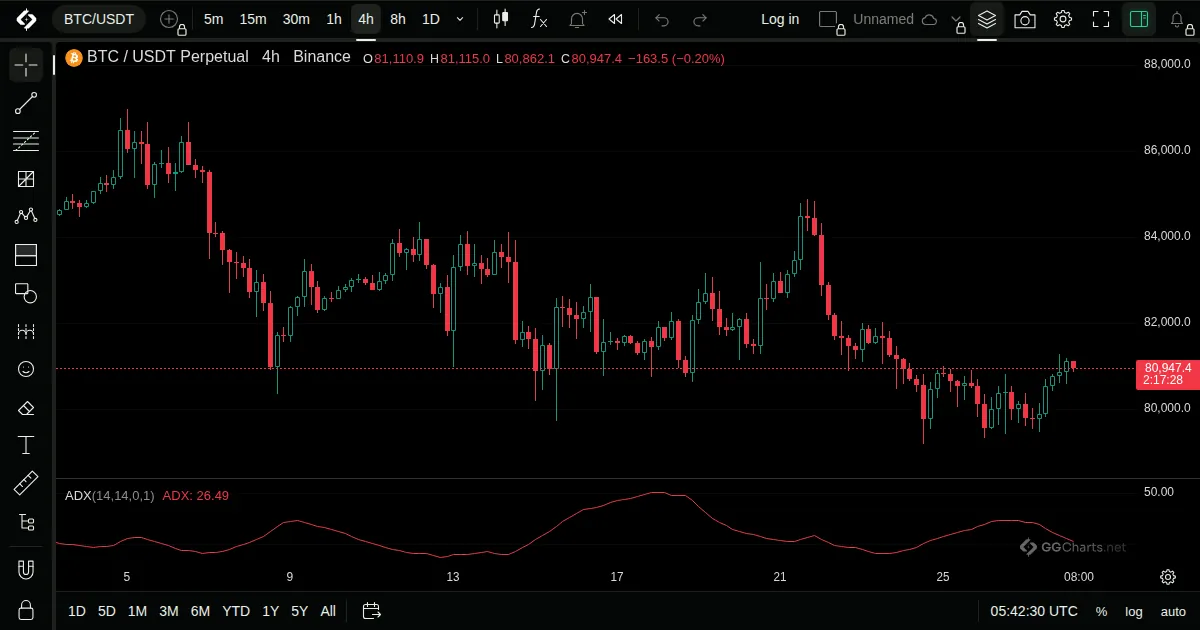
- What it shows
ADX measures trend strength, not direction. Read it alongside price or the directional movement lines.
- How it is built
It compares how far price moves up and how far it moves down over the period, takes the gap between the two as a share of the total, and smooths it.
- How to use it
- Below about 20 is usually read as a weak trend or a range, above 25 as a trend.
- A rising ADX means the trend is getting stronger, a falling one that it is fading.
- It says nothing about direction. Read it with price or the DMI lines.
- History
Introduced in New Concepts in Technical Trading Systems (1978).
J. Welles Wilder Jr., 1978
Related indicators
Directional Movement IndexHull Moving AveragePivot Points StandardBull Bear Index