Pivot Points Standard
Trend, Pivots
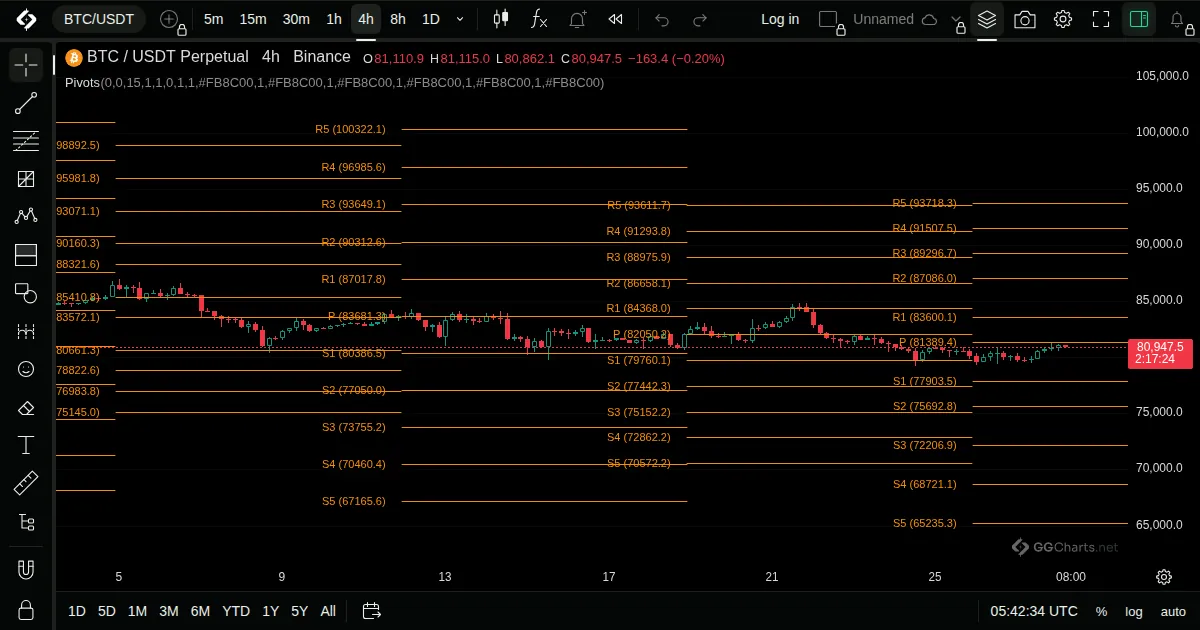
- What it shows
Horizontal levels calculated from the previous period's prices: a central pivot with support and resistance lines around it.
- How it is built
The pivot is the average of the previous period's high, low and close. Supports and resistances are placed at distances from it based on that period's range.
- How to use it
- Price above the pivot leans bullish, below it bearish.
- The levels are watched as places where price may pause or turn.
- Levels calculated from a completed previous period stay fixed during the current period.
Related indicators
Bull Bear IndexDifferent Of Moving AverageMoving Average WeightedDouble EMA