Moving Average
Trend, MA
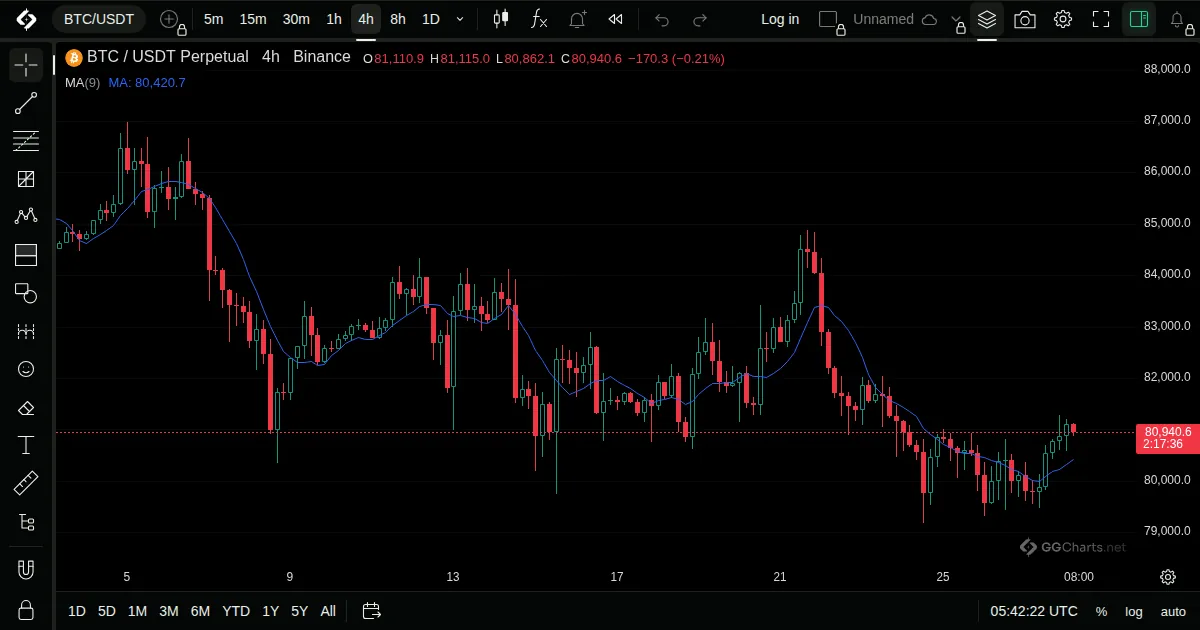
- What it shows
Moving Average plots the mean closing price over the selected number of bars. A longer period smooths the line and adds lag.
- How it is built
Add the last N closes and divide by N. Every bar in the window counts equally, and the oldest one drops out as a new bar arrives.
- How to use it
- A rising line with price above it is read as an uptrend, a falling line with price below it as a downtrend.
- A longer length smooths the line more and increases its lag.
- Price crossing the line, or a fast line crossing a slow one, is the usual signal to look at.
Related indicators
Moving Average ExponentialSmoothed Moving AverageSupertrendIchimoku Cloud