Donchian Channels
Volatility, DC
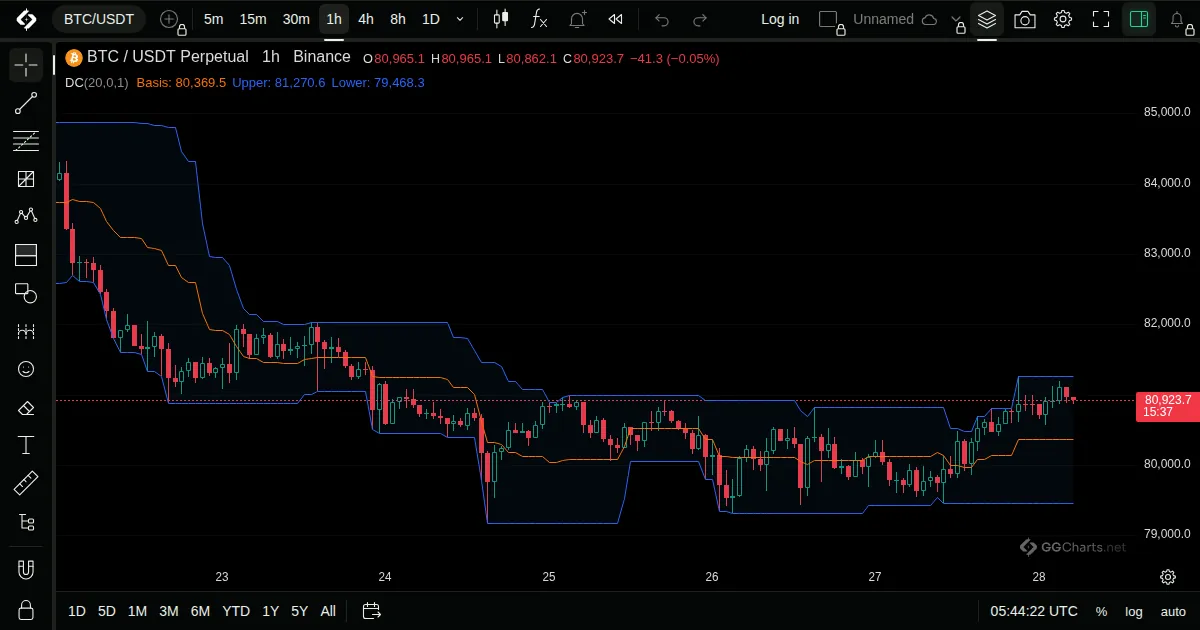
- What it shows
A channel made of the highest high and the lowest low of the last N bars, with a middle line between them.
- How it is built
The upper line is the highest high of the period and the lower line the lowest low. The middle line is their average.
- How to use it
- A close above the upper line is a breakout to the upside.
- A close below the lower line is a breakout to the downside.
- A narrow channel shows a quiet market.