Chandelier Exit
Trend
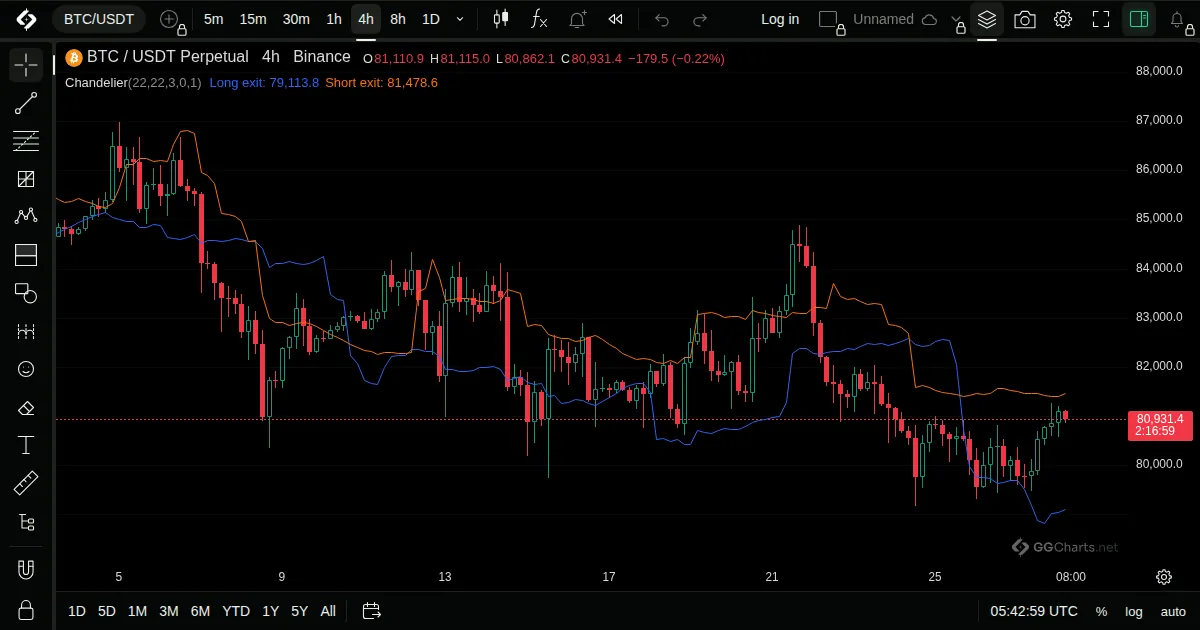
- What it shows
Two trailing exit lines hung from the highest high and the lowest low, a few volatility units away, like a chandelier from a ceiling.
- How it is built
The long exit is the highest high of the period minus a multiple of the Average True Range, the short exit is the lowest low plus the same.
- How to use it
- The long exit rises with an uptrend and never drops.
- A close under it is read as the end of the move.
- A bigger multiplier gives more room and fewer exits.
Related indicators
Time-Weighted Average PriceLinear Regression ChannelPivot Points High LowVisible Average Price