Chaikin Oscillator
Volume
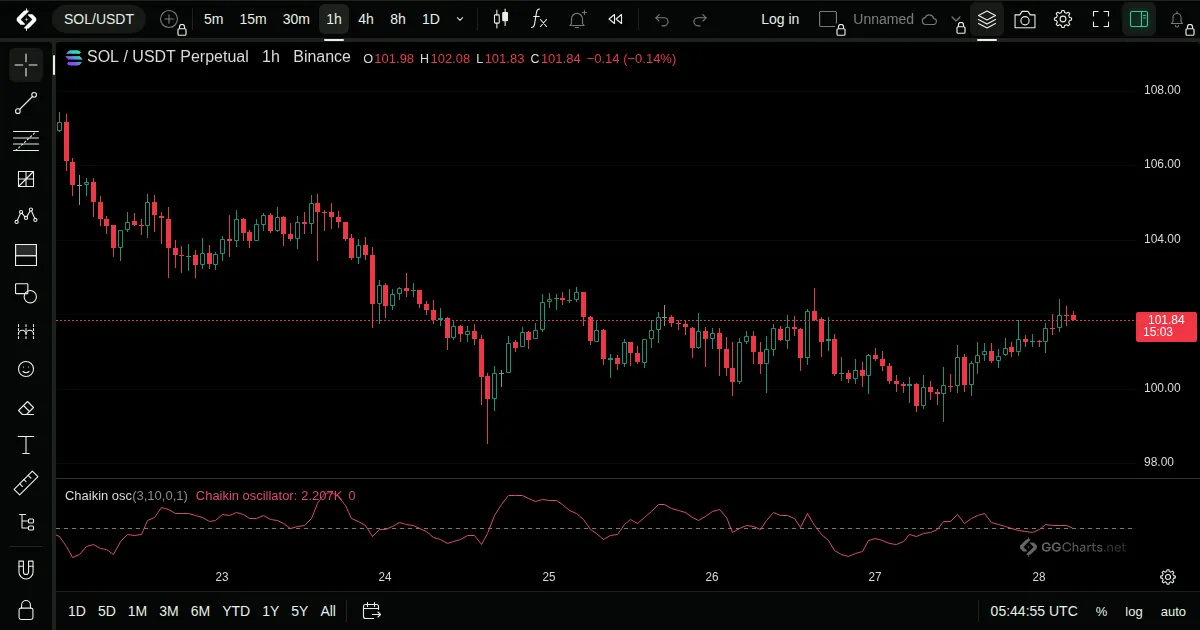
- What it shows
The gap between a fast and a slow average of the Accumulation/Distribution line.
- How it is built
A 3-period EMA of the A/D line minus a 10-period EMA of it.
- How to use it
- Above zero: accumulation is speeding up.
- Below zero: distribution is speeding up.
- A divergence from price is a warning.
Related indicators
Accumulation/DistributionElder Force IndexKlinger OscillatorPercentage Volume Oscillator