潰瘍指數
波動率
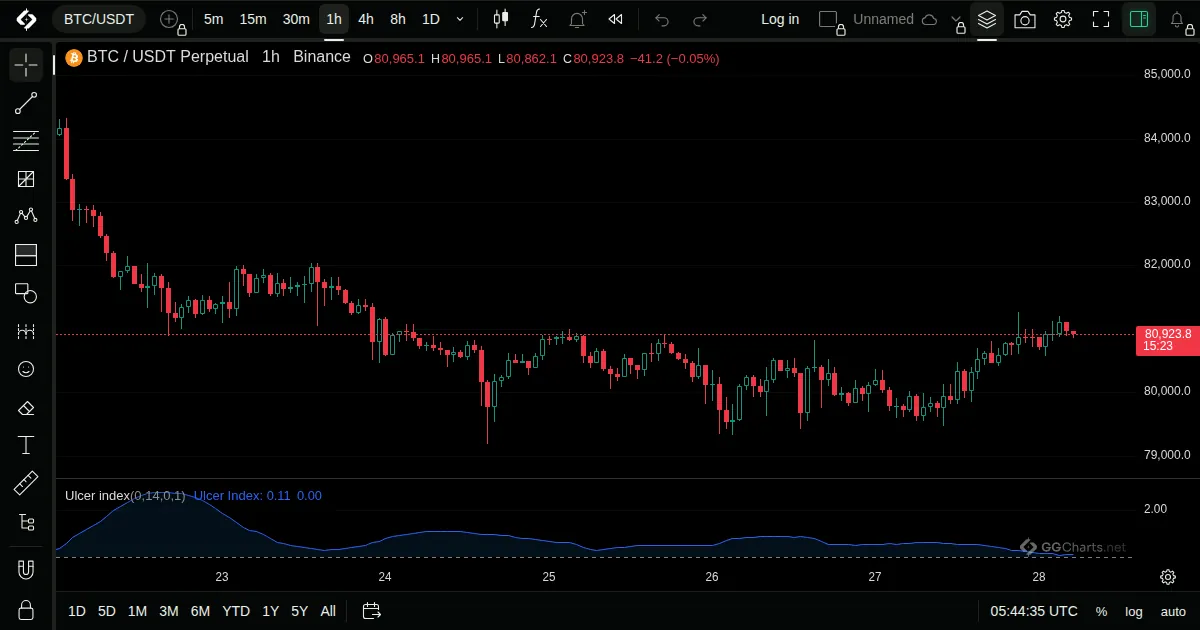
- 顯示內容
衡量下行風險:價格低於近期高點的深度與持續時間。
- 計算方式
它是該期間每根 K 線收盤價相對最高收盤價之百分比跌幅平方平均值的平方根。
- 如何使用
- 數值高表示價格自近期高點出現深幅或長時間的下跌。
- 數值低表示價格維持在接近高點的位置。
- 它只計算下跌,不計算上漲。
- 歷史
由 Peter Martin 與 Byron McCann 於 1980 年代末期開發。
Peter Martin 與 Byron McCann,1980 年代末
波動率
衡量下行風險:價格低於近期高點的深度與持續時間。
它是該期間每根 K 線收盤價相對最高收盤價之百分比跌幅平方平均值的平方根。
由 Peter Martin 與 Byron McCann 於 1980 年代末期開發。
Peter Martin 與 Byron McCann,1980 年代末